
INDUSTRY · Forestry
Aerial Forest Intelligence for Smarter, Safer and More Productive Decisions
Decision-ready forest data: tree-accurate, spatially consistent and model-aligned, for establishment quality, stocking control, inventory expansion, harvest design and environmental reporting.
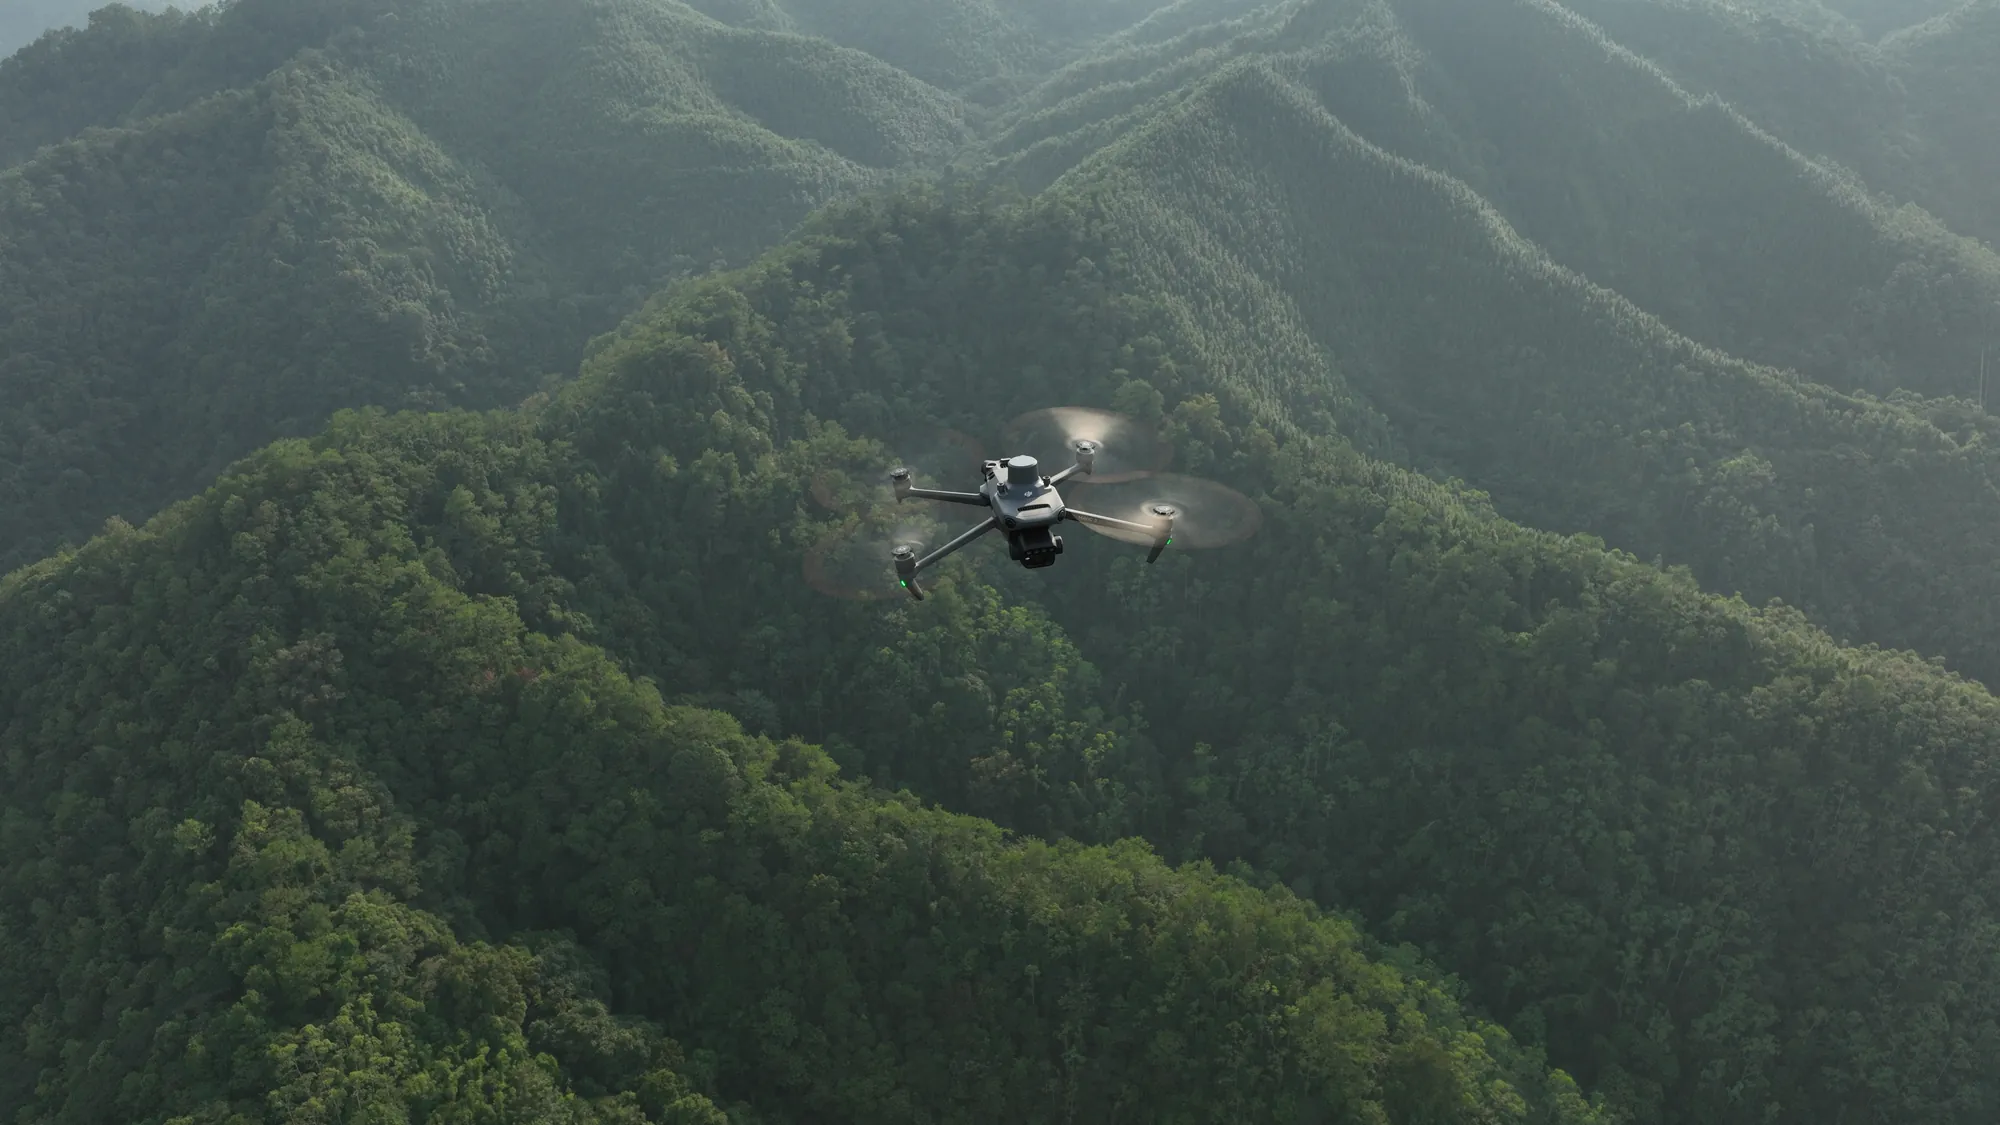
Why drones
40–80%
MORE STAND COVERAGE PER DAY
- Safer operations: reduced exposure to steep terrain, slash, unstable ground
- Repeatable imagery and measurements for establishment, thinning and harvest assurance
- Tree-level and grid-based information on stocking, spacing, canopy and gaps
- LiDAR-derived terrain and canopy structure for inventory, access and harvest planning
- Faster identification of understocked, overstocked, stressed or damaged areas
- Targeted allocation of planting, thinning, pest-control and field-verification resources
- Stronger evidence for contractor performance, valuation, environmental reporting and investment decisions
Drones don’t replace foresters. They amplify them.
Key use cases
Where drone forestry earns its place.
01
Stand count & stocking assessment
Drone imagery and LiDAR support virtual plots and stand-level counts, providing stems-per-hectare estimates and spatial variation that ground sampling alone cannot capture. Stocking grids clearly show understocked, target and high-density zones, strengthening silviculture decisions and contractor performance review.
TREE LOCATIONS · STOCKING GRIDS · PLOT SUMMARIES
02
Establishment and survival
High-resolution RGB capture reveals planted trees, natural regeneration, missed locations and early mortality across entire stands. Automated detections and survival maps highlight underperforming areas, enabling targeted blanking, field checks and early intervention, improving establishment quality and reducing costly rework.
TREE DETECTIONS · SURVIVAL MAPS · DENSITY HEATMAPS
03
Thinning assessment & prescription
Pre-thinning capture maps current stocking and identifies where removals are required to meet silvicultural targets. Repeat capture validates residual density, uniformity and compliance. Thinning maps and operational registers provide clear guidance for contractors and defensible evidence for quality assurance.
PRE/POST-THINNING MAPS · RESIDUAL-DENSITY MODELS · WORK REGISTERS
04
Tree-level inventory & yield modelling
LiDAR and calibrated field plots produce canopy-height models, structural metrics and spatial variation in forest attributes. When aligned with approved models, these surfaces support inventory imputation, yield analysis, harvest scheduling and valuation.
CHM · CANOPY METRICS · INVENTORY GRIDS · YIELD SURFACES
05
Harvest progress, cutover & residue assessment
Repeat aerial capture documents harvest boundaries, progress, completed cutover and remaining woody debris. Photogrammetry and LiDAR support residue assessment, stockpile measurement and compliance evidence, improving reporting accuracy and reducing disputes.
ORTHOMOSAICS · CUTOVER MAPS · RESIDUE DENSITY · STOCKPILE MEASUREMENTS
06
Terrain, access & harvest planning
LiDAR penetrates canopy to map ground terrain, slopes, drainage, roads and landings. These layers help planners understand access, machine suitability, extraction routes and safety constraints before mobilisation, reducing operational risk and improving harvest-block design.
DTM · SLOPE MAPS · ACCESS CONSTRAINTS · DRAINAGE LAYERS
07
Forest health, stress & pest monitoring
RGB, multispectral and thermal sensors reveal canopy discolouration, vegetation stress, pest activity and fire indicators. These layers help detect issues earlier, prioritise field verification and support pest-control planning: strengthening forest health monitoring across large, remote areas.
NDVI/NDRE · THERMAL IMAGERY · STRESS MAPS · PEST-RISK LAYERS
08
Carbon, biodiversity & environmental monitoring
Repeat remote sensing supports canopy-cover assessment, biomass-related metrics, riparian monitoring, erosion review and long-term change analysis. These layers strengthen environmental reporting, biodiversity assessment and carbon-relevant modelling across the estate.
CANOPY METRICS · CARBON SURFACES · HABITAT LAYERS · CHANGE DETECTION
09
Storm, fire & damage assessment
After wind, fire or slips, drones rapidly map affected areas without requiring immediate ground access. Georeferenced imagery and thermal data identify windthrow, blocked roads, unstable terrain and fire perimeters, supporting salvage decisions and recovery planning.
DAMAGE CLASSIFICATION · THERMAL LAYERS · RECOVERY PRIORITY MAPS
Deliverables
Drone data outputs.
A suite of forestry-ready deliverables that traditional field-only methods or satellite data cannot match for speed, resolution or completeness.
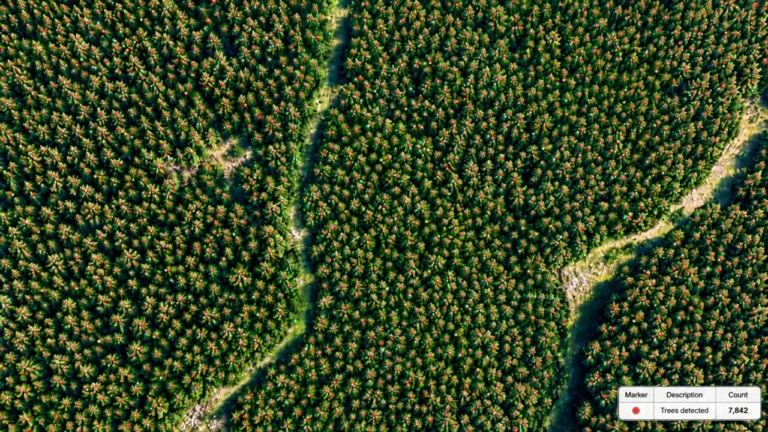
Tree Detections
Automated identification of individual trees or crowns from high-resolution RGB or LiDAR-derived canopy surfaces
Used for
- Establishment review
- survival assessment
- stocking analysis
- thinning validation
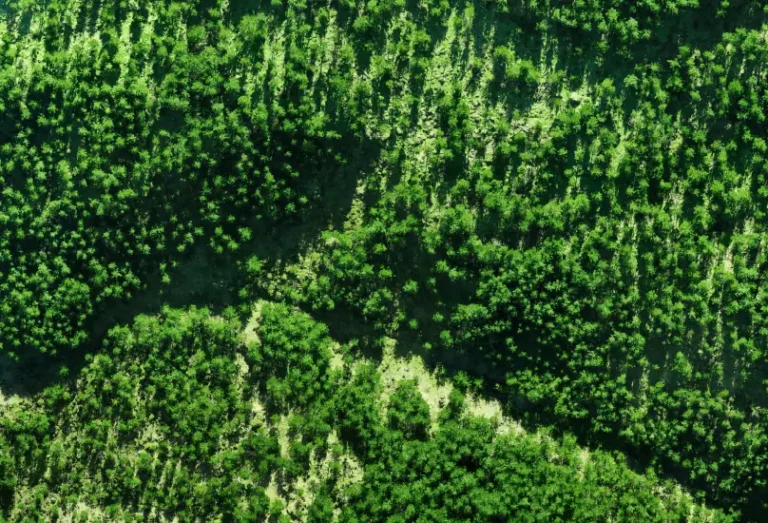
Orthomosaics
High-resolution, distortion-free georeferenced aerial maps built from RGB imagery
Used for
- Stand mapping
- boundary checks
- cutover documentation
- operational planning
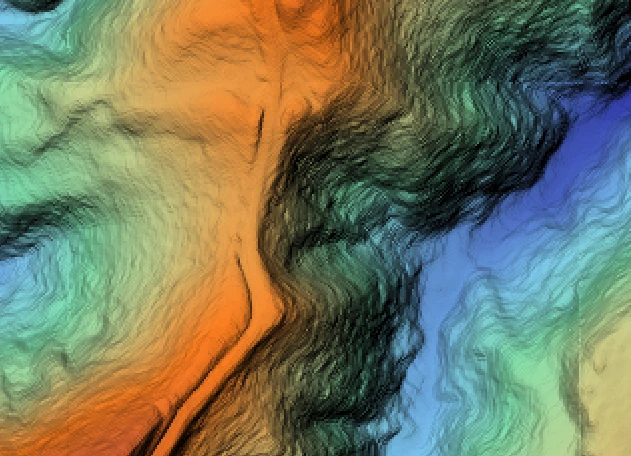
Digital Terrain Models (DTM)
Bare-earth elevation models derived from LiDAR, with vegetation removed
Used for
- Slope analysis
- access planning
- drainage review
- harvest-block design
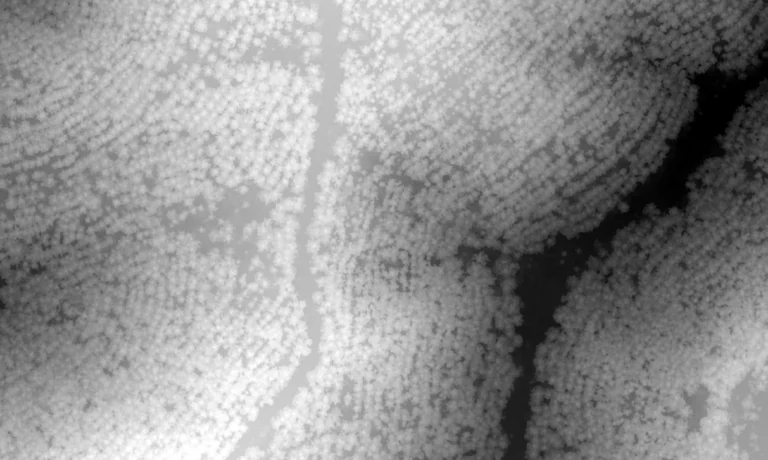
Digital Surface Models (DSM)
Elevation of canopy, vegetation and visible surfaces captured from photogrammetry or LiDAR
Used for
- Canopy structure analysis
- height variation
- gap identification
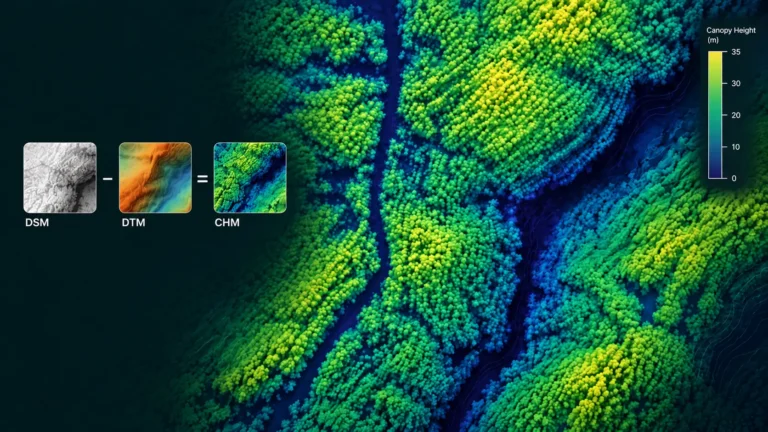
Canopy Height Models (CHM)
Height of vegetation above ground, created by subtracting DTM from DSM
Used for
- Tree-height estimation
- inventory modelling
- growth monitoring
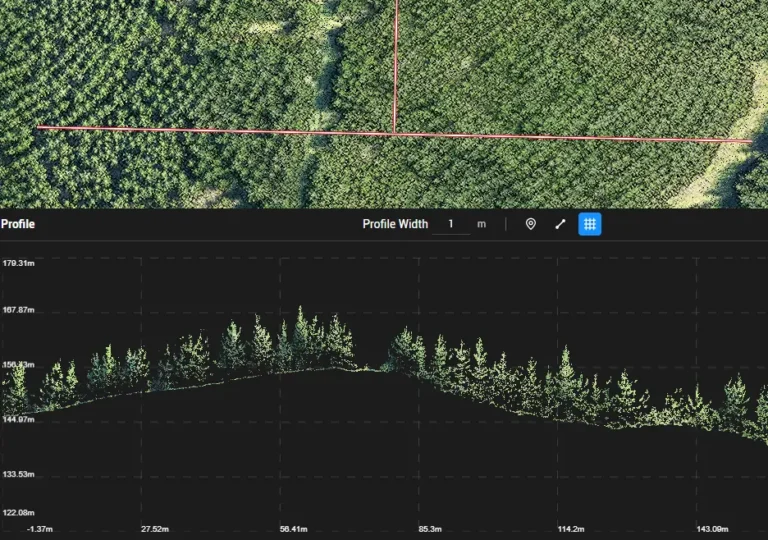
LiDAR Point Clouds
Millions of georeferenced points representing ground, vegetation and canopy structure, classifiable into layers
Used for
- Terrain modelling
- canopy analysis
- tree segmentation
- inventory workflows
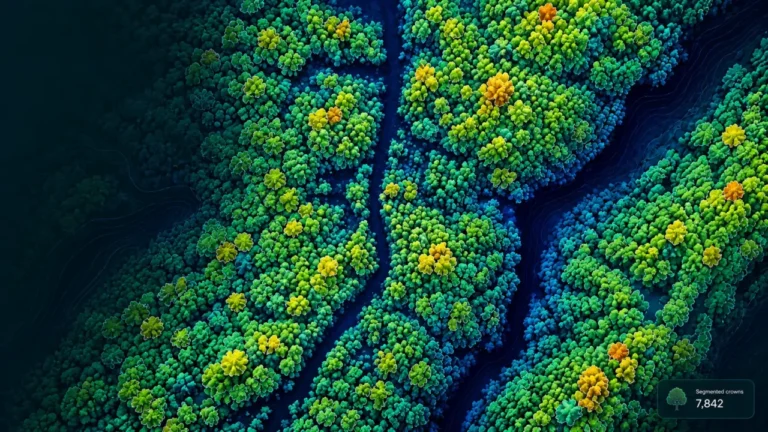
Tree Segmentation Layers
LiDAR-derived separation of individual trees or crowns into discrete objects
Used for
- Tree-level metrics
- stocking
- thinning analysis
- inventory calibration
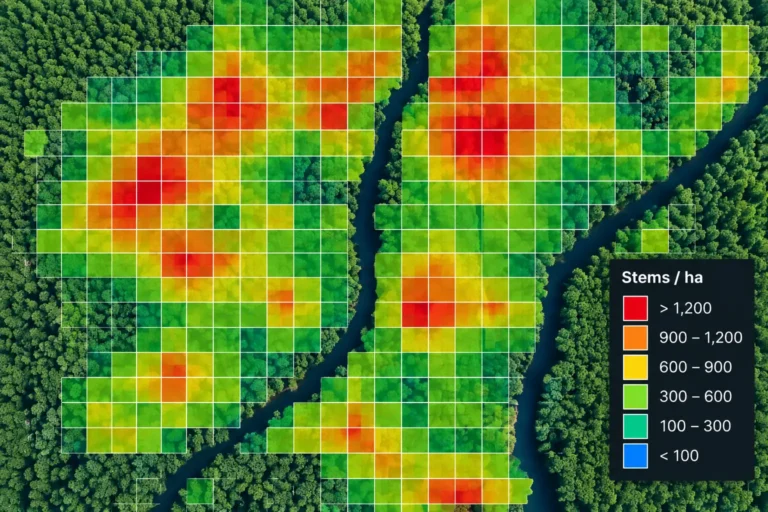
Stocking & Density Grids
Spatial summaries of stems-per-hectare across plots, grids or stands
Used for
- Establishment quality
- thinning design
- resource allocation
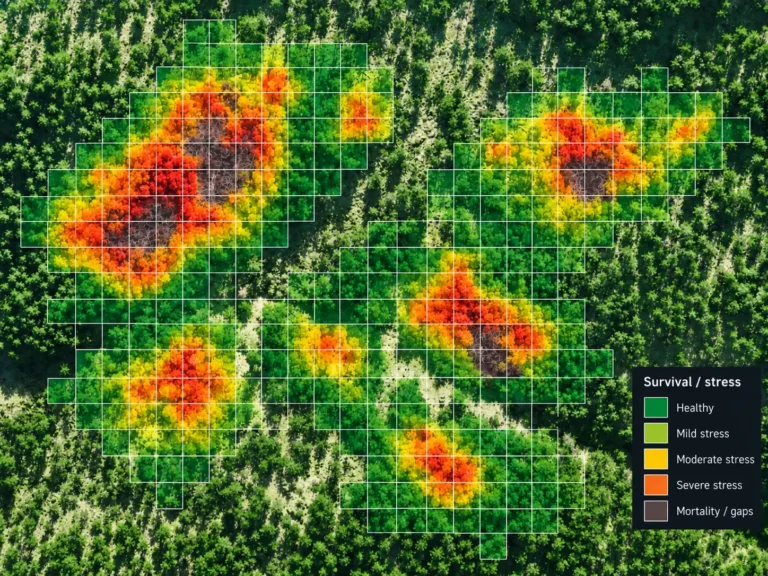
Survival & Stress Maps
Spatial layers showing survival rates, canopy discolouration or stress indicators
Used for
- Blanking decisions
- forest-health screening
- targeted field checks
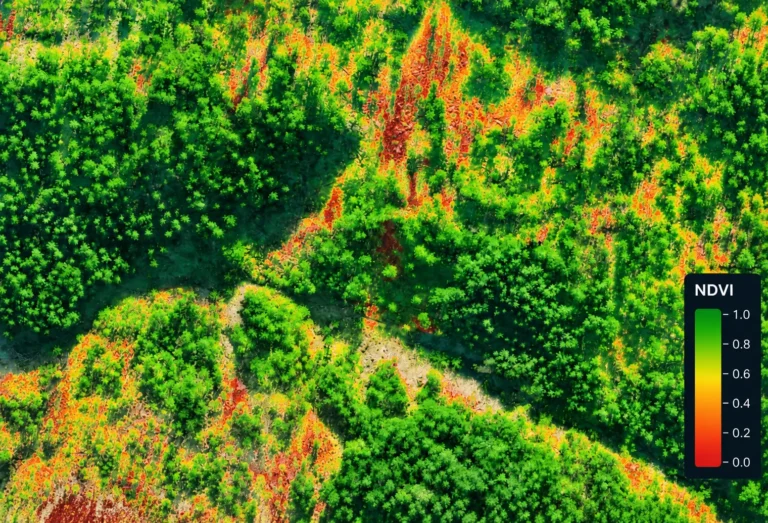
NDVI / NDRE Vegetation Indices
Multispectral layers showing vegetation vigour, stress and canopy condition
Used for
- Health monitoring
- pest-risk assessment
- environmental reporting
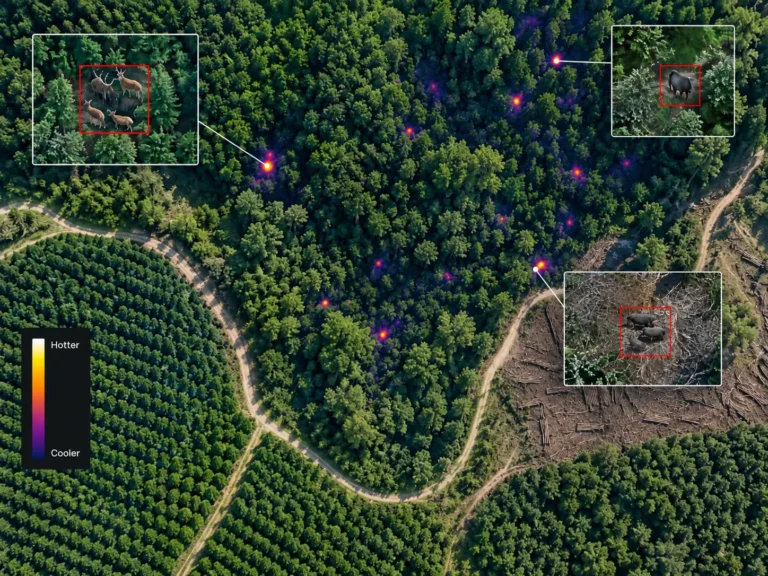
Thermal Imagery
Radiometric temperature layers captured from thermal sensors
Used for
- Fire hotspots
- pest activity
- moisture detection
- night operations
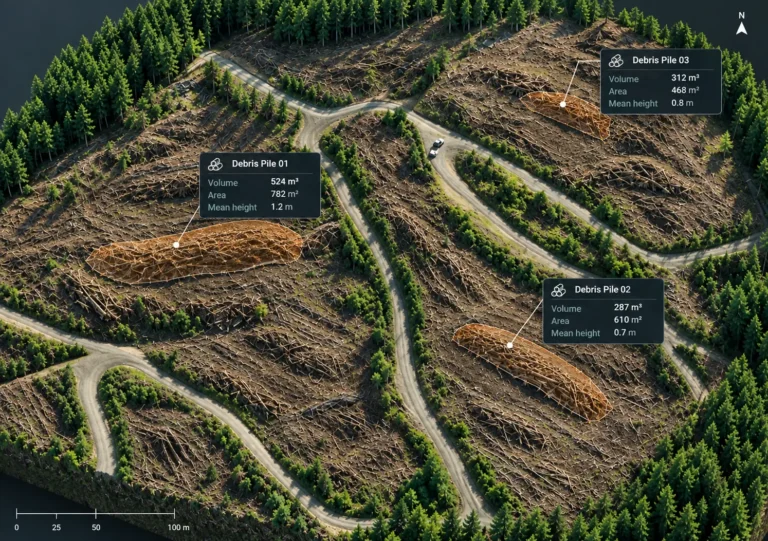
Cutover & Residue Layers
Georeferenced maps showing harvest boundaries, residue density and woody debris
Used for
- Harvest progress tracking
- residue assessment
- compliance evidence
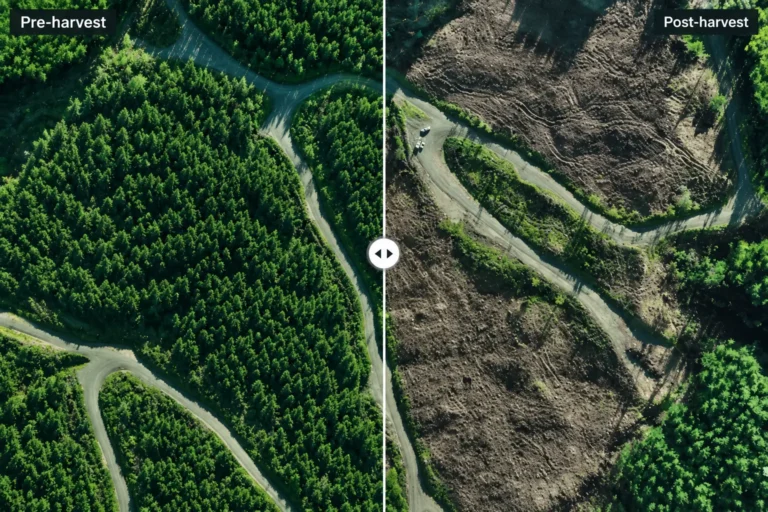
Change Detection Layers
Time-series comparisons of imagery or LiDAR to reveal growth, damage or operational change
Used for
- Seasonal monitoring
- post-treatment verification
- storm/fire assessment
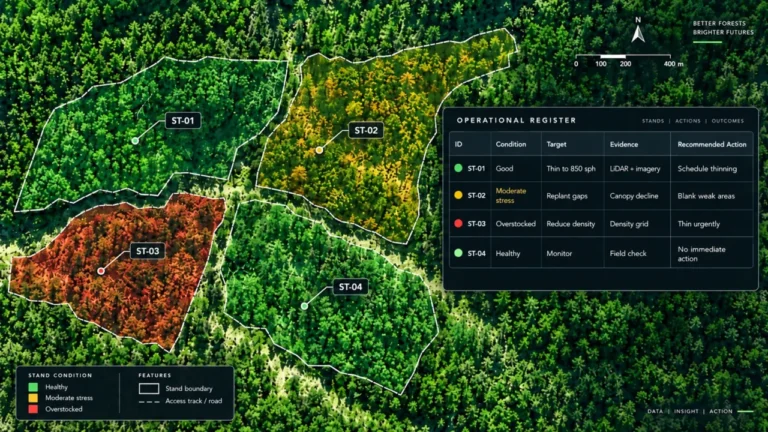
Operational Registers
Structured datasets linking stand/grid IDs to condition, targets, evidence and recommended action
Used for
- Thinning prescriptions
- contractor guidance
- audit trails
Getting it right
Accuracy is everything.
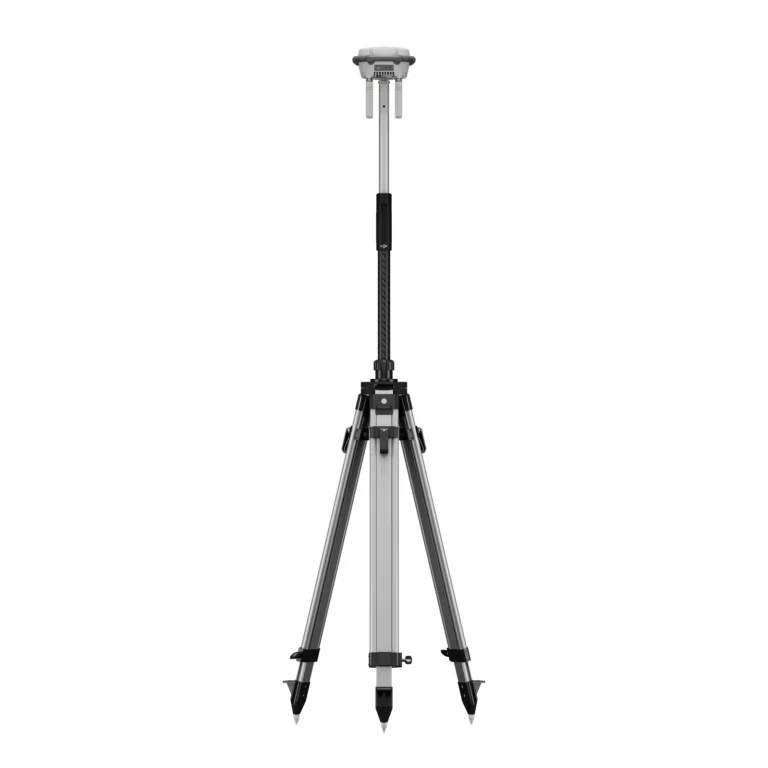
With GNSS positioning and the right drone platform, your accuracy requirements are achievable.
- RTK/PPK positioning
- Ground Control Points (GCPs)
- Checkpoints & QA workflows
- Photogrammetry vs LiDAR selection
- Clear communication of limitations
Fits the systems you already run.
Outputs arrive clean, structured and forestry-ready.
GIS
ArcGIS · QGIS · web-based forest mapping platforms
FOREST INFORMATION SYSTEMS
Estate · stand · compartment · inventory · activity-management systems
INVENTORY & YIELD
Plot-modelling environments · valuation tools · harvest-scheduling platforms
PHOTOGRAMMETRY
DJI Terra · Pix4D · RealityCapture · Agisoft Metashape
LIDAR
DJI Terra · TerraScan · CloudCompare
FIELD OPERATIONS
Mobile GIS · contractor work maps · silviculture verification forms
ENTERPRISE
SharePoint · secure cloud storage · dashboards · data lakes
Products
Systems & equipment for Forestry
Drones
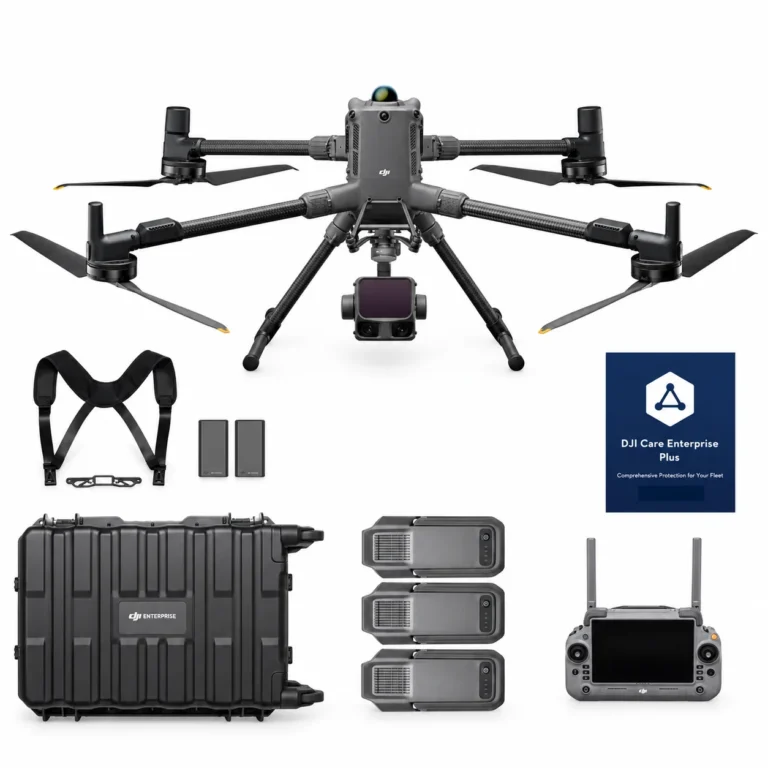
DJI Matrice 400 L3 Combo
AIQ-0100
1535 nm long-range LiDAR, dual 100MP RGB mapping cameras and a high-precision POS system, paired with the long-endurance DJI Matrice 400 enterprise platform for high-efficiency geospatial data capture. The Matrice 400 L3 Combo includes the Zenmuse L3 and three aircraft batteries, creating a complete solution for large-area surveying, corridor mapping, forestry and infrastructure projects.
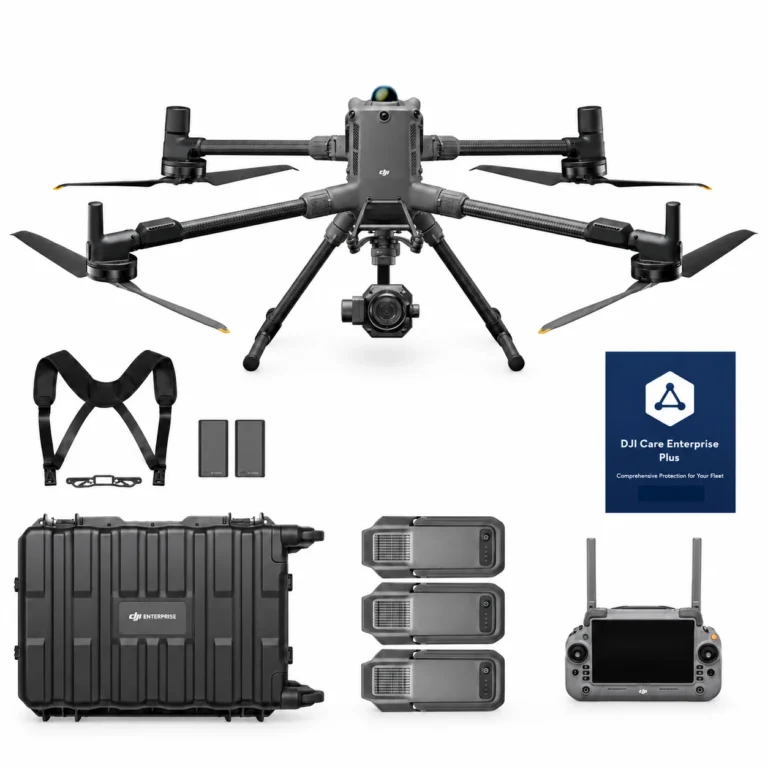
DJI Matrice 400 P1 Combo
AIQ-0101
45MP full-frame photogrammetry camera, global mechanical shutter and support for interchangeable 24 mm, 35 mm and 50 mm DJI DL lenses, paired with the long-endurance DJI Matrice 400 enterprise platform for high-accuracy aerial mapping. The Matrice 400 P1 Combo includes the Zenmuse P1 and three aircraft batteries, creating a complete solution for surveying, construction, land development, mining and large-scale photogrammetry projects.
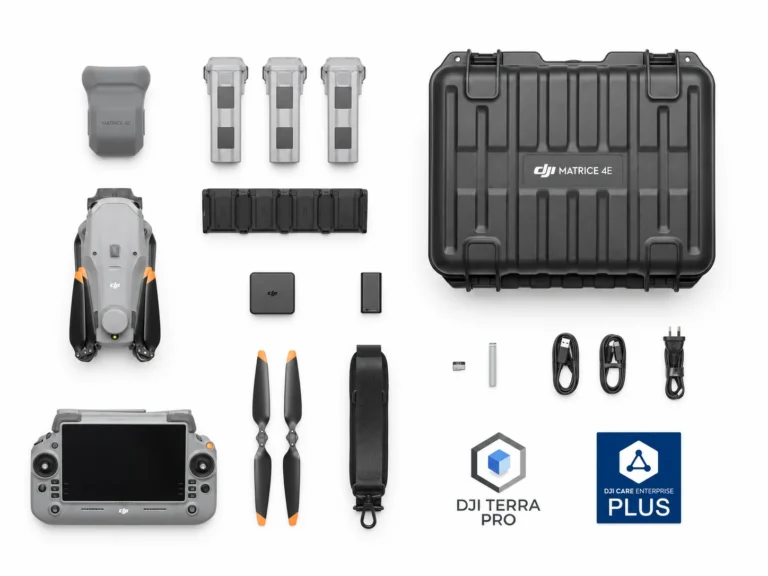
DJI Matrice 4E Essentials Combo
AIQ-0090
Combining a 20MP 4/3” CMOS, mechanical-shutter camera with RTK positioning and intelligent mapping tools to form the ultimate compact mapping drone. Fast image capture, multi-directional photography and Smart 3D capabilities help streamline aerial data collection across surveying, construction and geospatial projects.
Dock Systems
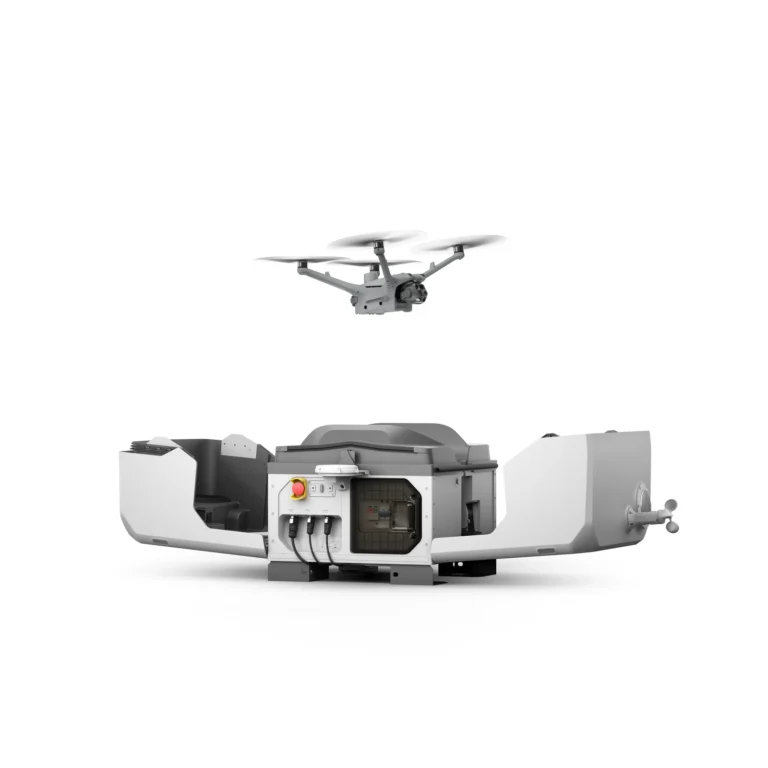
Accessories & Parts
Our services
How AeroIQ helps in this sector
Drone Consulting
Plan the right drone programme, workflows, governance and technology pathway from the start.
Drone Training
Build internal pilot capability through practical training, coaching and real-world operating scenarios.
Drone Hardware
Choose, configure and validate drone hardware, sensors and software so it works from day one.
Let’s talk